Statistics

stats

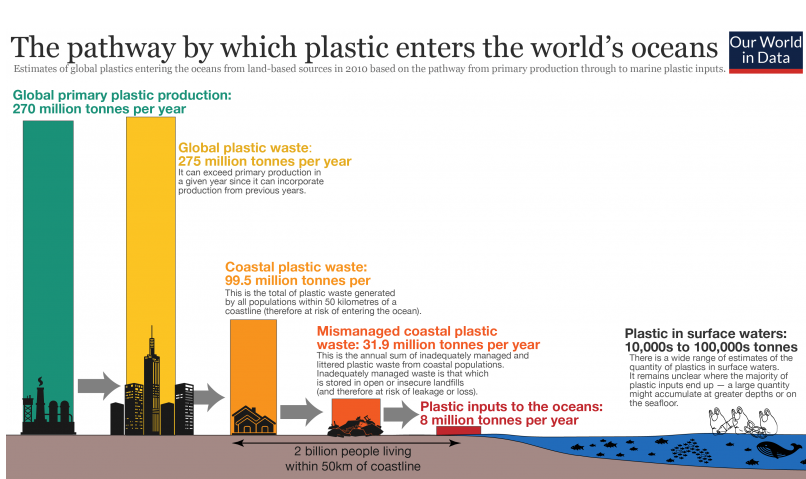
How much plastic enters Ocean.

To understand the magnitude of input of plastics to the natural environment and the world’s oceans, we must understand various elements of the plastic production, distribution and waste management chain. This is crucial, not only in understanding the scale of the problem but in implementing the most effective interventions for reduction. The data and visualizations which follow in this entry provide this overview step-by-step. This overview is summarized in the figure.

stats

Waste Generation Pie

Global plastic production to fate In the figure we summarize global plastic production to final fate over the period 1950 to 2015. This is given in cumulative million tonnes. Of the 5800 million tonnes of primary plastic no longer in use, only 9 percent has been recycled since 1950.

stats

Global Mismanaged Waste

The data presented in the analysis above is for the year 2010; how is this global picture likely to change over time? Jambeck et al. (2015) also project mismanaged plastic waste production for the year 2025.

These results are presented in the map as the share of global mismanaged waste by country, and aggregated by region. Absolute figures (in tonnes per year) by country is available to explore here.

Overall we see that the global distribution is projected to change only slightly; whilst China’s contribution falls by a couple of percentage points, East Asia & Pacific maintain around 60 percent of the total. South Asia’s contribution — largely driven by India — increases slightly, as does Sub-Saharan Africa. Latin America, the Middle East & North Africa, Europe and North America all fall in relative terms